Sankey diagram to represent flow
Date: 2025 02-February 07
Strategy:
- Emerson Ovation .diag file
- Create rectangles that change in width based on flow volume through a linked system. Do not change height. Keep rectangles centered. See pen-and-paper drawing below.
- Excel:
- Use an Excel add-in, such as ChartExpo, and insert a sankey chart from the My Apps menu, then select your data and create the chart
- Python Examples:
- plotly.com/python/sankey-diagram/
- How to create a Sankey diagram in 30 seconds with Python (step-by-step guide) | Fabi.ai
- Sankey diagram
- How To Create Sankey Diagrams from DataFrames in Python | by ken lok | KenLok | Medium
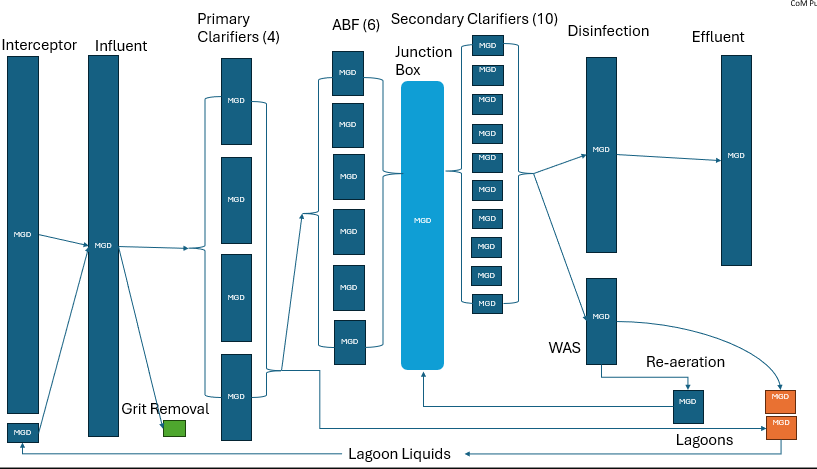
I want to represent flow through the plant based on volume. Something like this: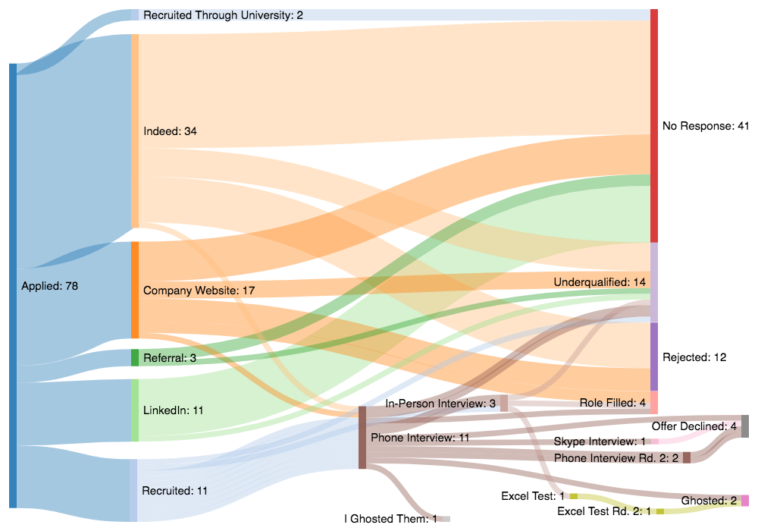
My version: